
What These Two Dispute Management KPIs Suggest About Your Chargeback Strategy
- 7 min read
A new report shows there’s a significant gap between merchants’ reported chargeback win rate and net recovery rate. In this blog, we’ll explain why this spells trouble for sellers.
Chargebacks, or forced payment reversals conducted at the banking level, can be a true headache for ecommerce merchants.
Every chargeback translates to lost revenue and higher fees. Over time, cumulative chargebacks can lead to substantial reputational damage as well. A merchant could even lose their ability to process card payments entirely, which could doom their business.
Chargebacks are a major source of revenue loss for businesses—according to data from Mastercard, consumers filed 615 million chargebacks in 2021. That translates to a projected total annual cost of $79 billion for merchants alone, not to mention the banks and other outlets that work alongside sellers.
Of course, that’s not to say that sellers have no recourse. If a merchant feels that a chargeback was filed without a valid reason, they can fight that issuance through a process called “representment.” How merchants analyze their success at representment, though, could substantially impact their risk management strategy.
As we’ll see, failing to track one’s net recovery rate, as well as win rate, could lead to recoverable revenue being left on the table.
Key analytics for chargeback management
Representment is the process of literally “re-presenting” a disputed charge to the issuing bank to overturn a chargeback decision. During representment, the business is required to provide compelling evidence that the transaction was valid and supply ample documentation to prove their argument. This can include (but isn’t limited to):
- Delivery confirmation documentation
- Signed orders
- Photographs
- Contracts
- Sales receipts
Representment is a complicated, time-consuming process and there’s no guarantee of success. For many businesses, optimizing representment is a question of trial-and-error. The key to ensuring merchants make the best use of their time and resources—and recover as much revenue as possible—is a figure known as chargeback win rate.
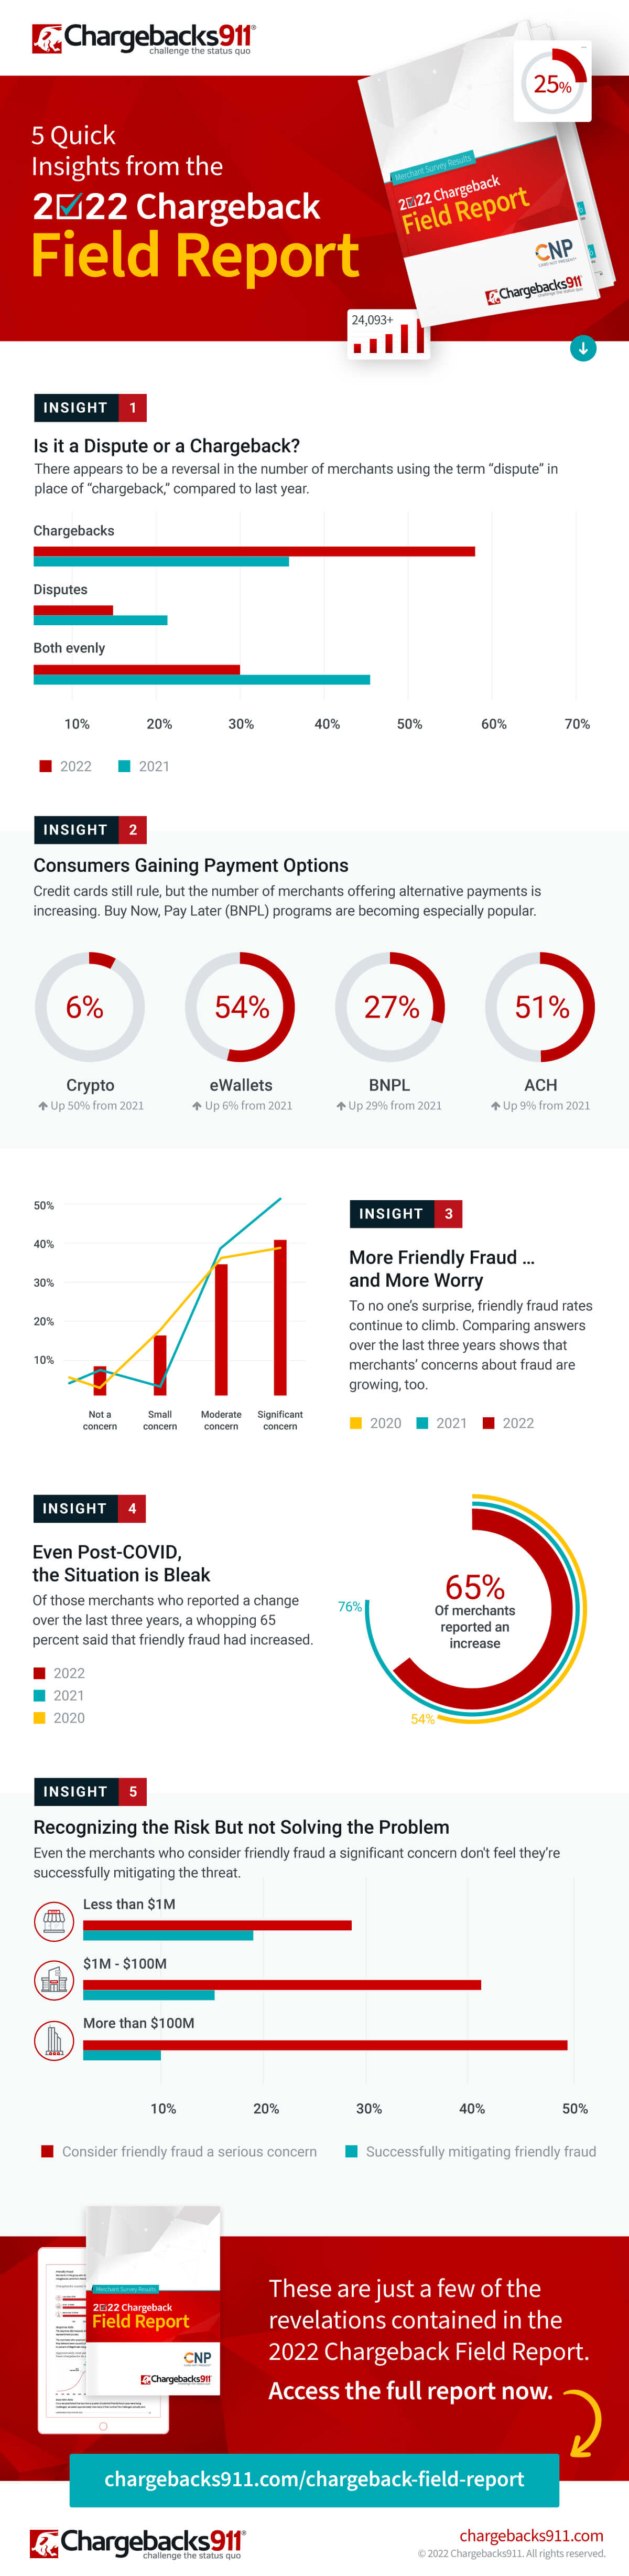
This metric is an important key performance indicator (KPI) for chargeback management. According to the 2022 Chargeback Field Report, the average merchant reported a chargeback win rate of 45%. This suggests merchants who engage in representment win nearly half of cases.
This is not a bad record... at least at first glance. If we dig a little deeper, we see that most survey respondents in the above-mentioned report failed to distinguish between their win rate and their net recovery rate (more on that shortly).
This is a big problem, because the survey found that the average merchant recovered revenue from only 9% of chargeback cases.
This disparity between the average chargeback win rate and net recovery rate suggests merchants are overlooking the latter KPI and relying solely on the former to gauge the effectiveness of their chargeback management. This mistake could literally translate to millions of dollars in unnecessary losses every year, depending on the scale of the business.
What’s the difference between chargeback win rate and net recovery rate?
As the name implies, chargeback win rate is the ratio of chargebacks that a merchant "wins" after submitting a response, as a portion of total chargebacks a response was submitted for. In contrast, "net recovery rate" is the ratio of chargebacks won as a portion of total chargebacks filed by customers.
Let’s assume that a business receives 100 chargebacks in a month. The merchant fights 25 of those chargebacks and wins 12 of them. That means the business has a win rate of almost 50%, which is quite good, relative to the average win rate reported by respondents to the Chargeback Field Report.
Things are a lot less rosy, though, if we look at the other statistic, as the merchant would have a net recovery rate of only 12%.
Internal data from Chargebacks911 suggests that roughly six in ten disputes filed by cardholders are likely invalid claims. This is a practice called “friendly fraud.” But, if that is the case, then why would a business like the one in our example be responding to just one in four chargebacks, and ultimately recovering only one in eight disputed charges?
The natural conclusion is that the business is probably leaving a lot of money on the table. They’re simply choosing not to fight chargebacks they could probably win if they took the initiative to contest them.
Why do cardholders file chargebacks?
Visa, Mastercard, and other card networks have generated dozens of reason codes outlining scenarios in which a cardholder might be entitled to a chargeback. Ultimately, though, we can segment all chargebacks according to three fundamental sources:
- Merchant error
- Third-party fraud
- First-party fraud
Chargebacks resulting from genuine merchant errors—like failing to follow up on customer inquiries, inaccurate product descriptions, and confusing billing descriptors—are legitimate. So, representment isn’t an option as there’s no additional evidence that will deflect responsibility for the dispute.
The same applies in cases of third-party fraud, as it’s the merchant’s responsibility to conduct due diligence and detect criminal tactics like account takeover and synthetic fraud.
First-party fraud schemes, like friendly fraud, are different. When a cardholder files a chargeback without a valid reason to do so, the merchant is entitled to try and recover their funds through representment.
The problem is that merchants, in general, are not very adept at separating friendly fraud from legitimate chargeback claims. Without keeping careful track of their net recovery rate alongside their chargeback win rate, however, a merchant might not even realize they have this issue.
Open data, transparency, and pattern analysis will allow businesses to recover more revenue
Gauging one’s efforts at fighting chargebacks seems like a straightforward matter. You either win disputes, or you don’t. But, a lack of transparency into the disputes that merchants tend to fight—and the ones they tend not to fight—creates a clear problem. Merchants can’t parse transaction data with enough detail to identify friendly fraud. But, in the long term, they can overcome this problem with broader access to industry data.
An open data scheme is one potential solution. If transaction data—particularly data related to payment disputes—were openly accessible to businesses and trade organizations, it would be much easier to identify trends in consumer behavior regarding chargeback issuances. Merchants could identify and track more relevant KPIs.
We’re a long way away from an industrywide, open data solution, though. Short of this, it’s vital that merchants conduct more in-depth analysis of historical transaction data. Looking at past transactions—and past disputes—makes it easier to pick up on patterns. This includes common signs associated with chargebacks, successful chargeback responses, and practices that mitigate risk.
Other KPIs to track for effective chargeback management
Beyond win rate and net recovery rate, there are of course other important KPIs to track for chargeback management.
A merchant’s chargeback rate, for instance, gauges the number of chargebacks a merchant receives as a percentage of overall transactions in each month. Tracking this KPI can give a merchant advanced warning if their chargeback issuances are trending upward, or if they’re in danger of breaching thresholds set by the card networks.
Return rate, or the number of items returned by customers, expressed as a percentage of monthly sales, is also important. If a merchant picks up on volatility in the number of refund requests received, this could mean their product descriptions are inaccurate or that there’s a problem in the fulfillment process.
These are just a few general examples. You’ll want to develop and track the KPIs that are the most relevant to your business’ needs, and any past struggles you may have had with fraud.
Tracking KPIs and data points like net recovery rate will not, on its own, solve problems like chargeback abuse or protect your business against concealed fraud attacks. But, by examining your dispute data in fine detail, you can develop a better—and more actionable—understanding of the threats facing your business and how you should respond.
About the author

Monica Eaton-Cardone
Monica Eaton-Cardone possesses more than two decades of experience in the fields of ecommerce, payments, fintech, and fraud prevention. As the Co-Founder and COO of Chargebacks911, Monica heads an industry-defining risk mitigation firm which protects more than 2 billion transactions annually to help online merchants optimize profitability through dispute management. Chargebacks911 is headquartered in the Tampa Bay area, with offices in North America and Europe.
Payment Fraud
Keep your company secure from bad actors looking to cash in.

Always stay up-to-date
Subscribe
Join the 50,000 accounts receivable professionals already getting our insights, best practices, and stories every month.